Knowledgebase Look-Up-Table – the Feature
The look-up table provides the ability to make adjustments to the picture within the camera. This takes place before the actual image processing in the PC. The Look-Up-Table works like a gradation curve. Comparable this technique is used at photo finishing with software like Photoshop.
The Look-Up Table adjusts the image to your requirements.
Conserve computing effort in you image processing system with the on-board camera look-up table.
For each digital representation of a grey value at the input, there is a corresponding grey value at the output. This way, contrast and dynamic range can be adjusted within given limits, gamma curves precisely defined or inverted values made available for further processing. The SVCam series with its LUT feature gives you full freedom to interpret your captured images.
Read more about using curves for image pre-processing.
The history of gradient curves
For the classical chemical film, gradient curves described how the photosensitive material reacted to light. Particularly in the whole process from developing the negative to making the paper prints, it was common to make use of various response curves to influence the final result.
Corresponding to the density of sensitive molecules on the paper, this either had a delaying or accelerating effect on incident light. Paper types with high molecular density reacted immediately on the exposed light when immersed the development fluid. Paper with lower density reacted correspondingly slower once exposed to higher intensities. The latter, however, displayed a higher dynamic when exposed to more intensive light, whereas paper with denser molecular distribution only had limited ability to resolve contrast.
In science, gradient curves are also referred to as growth curves that describe and illustrate relationships, such as the exponential function of the proliferation in the number of species up to a maximum.
Digital implementation
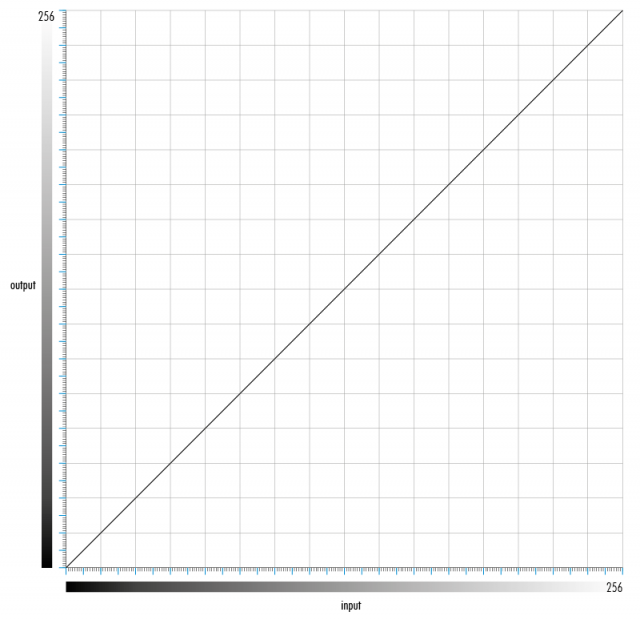
In industrial machine vision, gradient curves are implemented with a look-up table; LUT for short. A LUT essentially describes the relationship between an input and an output value in the form of a digital table. In the table grey levels are discretely connected.
To program or illustrate such LUTs, a graphical representation is often used. In the same manner, graphical illustration lends itself well to quickly and intuitively realize curves with properties for the subsequent image processing.
The SVS-VISTEK Look-Up Table
The in-camera look-up table mostly uses a 12 to 8-bit conversion. This results in a reasonable amount of computing effort and a smooth implementation of the curve. In addition, this also reduces the computing burden for your CPU/GPU. These resources are freed up for higher frame rate and you specific image processing algorithms.
Using the different curves
The table in the LUT is capable to implement any imaginable curve. Below, the most common ones are described:
Gamma = 1
The table in the LUT is capable to implement any imaginable curve. Below, the most common ones are described:
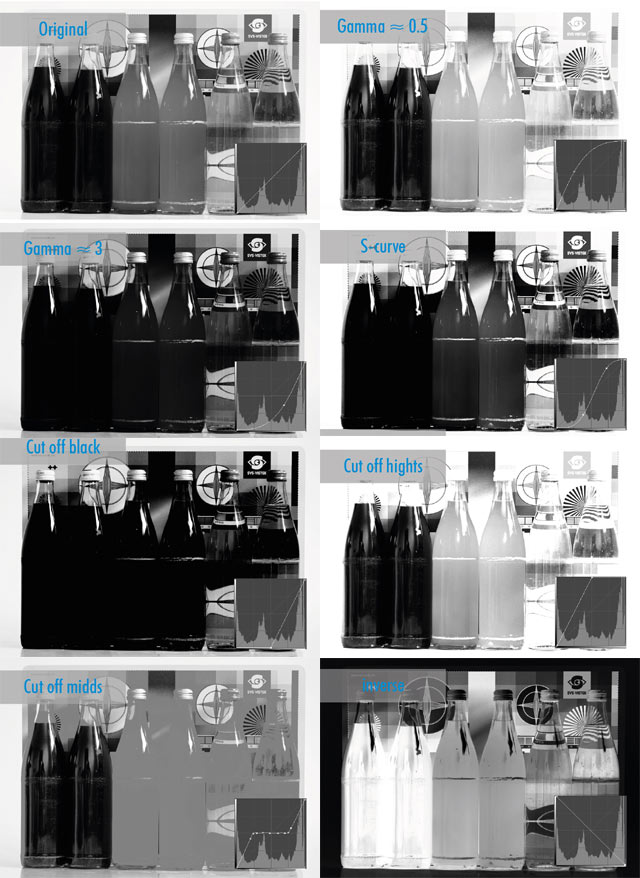
Gamma < 1
This emphasizes the dynamic in the brighter areas. Only a few Bytes of interface data contain information pertaining to the darker areas of the image.
The human eye is said to have a gamma characteristic of 0.3 to 0.5, confirming the fact that humans are creatures that are predominantly active during daytime.
Gamma > 1
Creating a curve with Gamma greater than 1, result in a shift in the dynamic towards ‘the dark side’. Brighter areas are thereby almost completely cut off.
To compensate for the non-linear dynamic representation of cathode ray tube (CRT) monitors, with their shortcomings in the dark areas, a Gamma value of 2.2 was applied to the images. This allowed the CRTs to also show full dynamic in the dark areas.
S-Curve
This is the most commonly used curve in digital photography. It applies more blackness to dark areas, makes bright areas brighter and provides dynamic in the middle range where ‘normal’ photos have the most relevant information.
Cut-Off
For the case that your image processing applications do not make use of the bright or dark areas in the image, the look-up table can easily completely suppress this information.
Equally, cut-offs in the middle are also imaginable, such that only the bright and dark regions in the image are passed on to the host PC.
Inverse
This interchanges bright and dark grey values.
All of the above curves can be infinitely combined, thus assisting you in getting your applications implemented much sooner.
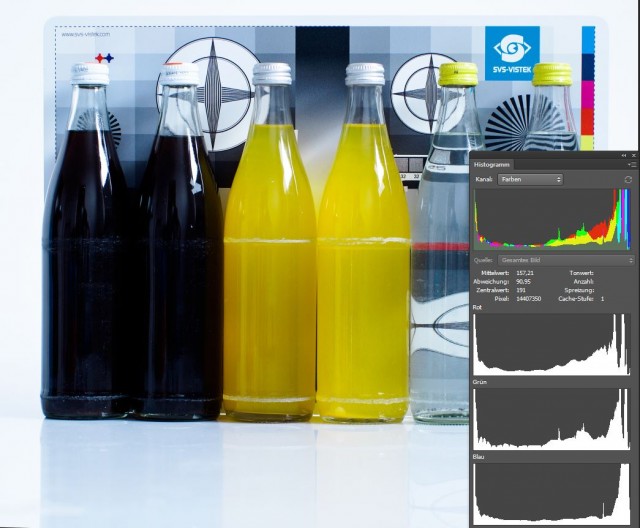
Histogram Tool
A histogram is used to identity the parts of the image that contain the majority of the information. The diagram describes the image from the darkest to the brightest area and shows clusters of grey values. A histogram can assist you in quickly locating areas that will require algorithms capable of higher resolution in your programming.